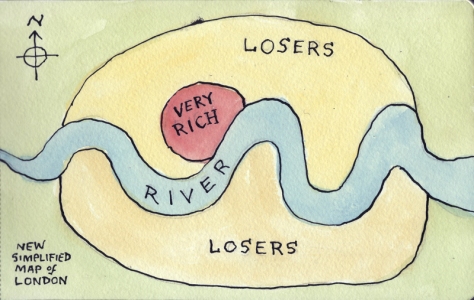
Simplified map of London


This map came from here. And so did the following comments:

  1. “I live in London and this map is fairly accurate. The Very Rich area would be Pimlico, maybe Notting Hill, Kensington and Chelsea, Westminster, the West End, Primrose Hill, maybe Hampstead. London has other wealthy areas but what differentiates these from those is that these areas have always been wealthy, rather than Johhny come lately areas that have been gentrified.”
  2. “General rules of thumb: in a city the wealthier neighborhoods tend to be upwind, upriver, and uphill. Occasionally extreme geographic constraints will override those rules. In the case of London, the Thames was horribly polluted and smelly in the first half of the 18th century (look up “The Great Stink”). My guess is that the “Very Rich” area would be the westernmost part of London in 1850, and that the “Losers” area west of there developed after the Thames was cleaned up. (I should line up some historical maps of London to the above map to see.)”
  3. “It just goes to show you. It takes a lot of losers to support a few rich folks.”
  4. “Have you seen the houses in Richmond or Hampstead? They don’t look like looser houses to me… There was actually an article in Time Out which mapped the London Boundary in relation to were the first Harvester eatery is located. So, were Harvester starts London stops. That is a clever way to show social divide within a city.”
US States Renamed For Countries With Similar GDPs


Gross Domestic Product (GDP) is a convenient way of measuring and comparing the size of national economies. Annual GDP represents the market value of all goods and services produced within a country in a year. Put differently:

GDP = consumption + investment + government spending + (exports – imports)

Although the economies of countries like China and India are growing at an incredible rate, the US remains the nation with the highest GDP in the world – and by far: US GDP is projected to be $13,22 trillion (or $13.220 billion) in 2007, according to this source. That’s almost as much as the economies of the next four (Japan, Germany, China, UK) combined.

The creator of this map has had the interesting idea to break down that gigantic US GDP into the GDPs of individual states, and compare those to other countries’ GDP. What follows, is this slightly misleading map – misleading, because the economies both of the US states and of the countries they are compared with are not weighted for their respective populations.

Pakistan, for example, has a GDP that’s slightly higher than Israel’s – but Pakistan has a population of about 170 million, while Israel is only 7 million people strong. The US states those economies are compared with (Arkansas and Oregon, respectively) are much closer to each other in population: 2,7 million and 3,4 million.

And yet, wile a per capita GDP might give a good indication of the average wealth of citizens, a ranking of the economies on this map does serve two interesting purposes: it shows the size of US states’ economies relative to each other (California is the biggest, Wyoming the smallest), and it links those sizes with foreign economies (which are therefore also ranked: Mexico’s and Russia’s economies are about equal size, Ireland’s is twice as big as New Zealand’s). Here’s a run-down of the 50 states, plus DC:

  1. California, it is often said, would be the world’s sixth- or seventh-largest economy if it was a separate country. Actually, that would be the eighth, according to this map, as France (with a GDP of $2,15 trillion) is #8 on the aforementioned list.
  2. Texas’ economy is significantly smaller, exactly half of California’s, as its GDP compares to that of Canada (#10, $1,08 trillion).
  3. Florida also does well, with its GDP comparable to Asian tiger South Korea’s (#13 at $786 billion).
  4. Illinois – Mexico (GDP #14 at $741 billion)
  5. New Jersey – Russia (GDP #15 at $733 billion)
  6. Ohio – Australia (GDP #16 at $645 billion)
  7. New York – Brazil (GDP #17 at $621 billion)
  8. Pennsylvania – Netherlands (GDP #18 at $613 billion)
  9. Georgia – Switzerland (GDP #19 at $387 billion)
  10. North Carolina – Sweden (GDP #20 at $371 billion)
  11. Massachusetts – Belgium (GDP #21 at $368 billion)
  12. Washington – Turkey (GDP #22 at $358 billion)
  13. Virginia – Austria (GDP #24 at $309 billion)
  14. Tennessee – Saudi Arabia (GDP #25 at $286 billion)
  15. Missouri – Poland (GDP #26 at $265 billion)
  16. Louisiana – Indonesia (GDP #27 at $264 billion)
  17. Minnesota – Norway (GDP #28 at $262 billion)
  18. Indiana – Denmark (GDP #29 at $256 billion)
  19. Connecticut – Greece (GDP #30 at $222 billion)
  20. Michigan – Argentina (GDP #31 at $210 billion)
  21. Nevada – Ireland (GDP #32 at $203 billion)
  22. Wisconsin – South Africa (GDP #33 at $200 billion)
  23. Arizona – Thailand (GDP #34 at $197 billion)
  24. Colorado – Finland (GDP #35 at $196 billion)
  25. Alabama – Iran (GDP #36 at $195 billion)
  26. Maryland – Hong Kong (#37 at $187 billion GDP)
  27. Kentucky – Portugal (GDP #38 at $177 billion)
  28. Iowa – Venezuela (GDP #39 at $148 billion)
  29. Kansas – Malaysia (GDP #40 at $132 billion)
  30. Arkansas – Pakistan (GDP #41 at $124 billion)
  31. Oregon – Israel (GDP #42 at $122 billion)
  32. South Carolina – Singapore (GDP #43 at $121 billion)
  33. Nebraska – Czech Republic (GDP #44 at $119 billion)
  34. New Mexico – Hungary (GDP #45 at $113 billion)
  35. Mississippi – Chile (GDP #48 at $100 billion)
  36. DC – New Zealand (#49 at $99 billion GDP)
  37. Oklahoma – Philippines (GDP #50 at $98 billion)
  38. West Virginia – Algeria (GDP #51 at $92 billion)
  39. Hawaii – Nigeria (GDP #53 at $83 billion)
  40. Idaho – Ukraine (GDP #54 at $81 billion)
  41. Delaware – Romania (#55 at $79 billion GDP)
  42. Utah – Peru (GDP #56 at $76 billion)
  43. New Hampshire – Bangladesh (GDP #57 at $69 billion)
  44. Maine – Morocco (GDP #59 at $57 billion)
  45. Rhode Island – Vietnam (GDP #61 at $48 billion)
  46. South Dakota – Croatia (GDP #66 at $37 billion)
  47. Montana – Tunisia (GDP #69 at $33 billion)
  48. North Dakota – Ecuador (GDP #70 at $32 billion)
  49. Alaska – Belarus (GDP #73 at $29 billion)
  50. Vermont – Dominican Republic (GDP #81 at $20 billion)
  51. Wyoming – Uzbekistan (GDP #101 at $11 billion)

This map was suggested by Morgan via strangemaps@gmail.com, and can be found here. Please note that the GDP data used for this comparison are not necessarily the same as those used in compiling the original map.

(this very cool post has come from this very cool blog)

More wallpapers! Mais wallpapers!


English: fall leaves wallpaper, fall season wa...

English: fall leaves wallpaper, fall season wallpapers, fall wallpaper hd, fall colors wallpaper, fall harvest wallpaper (Photo credit: Wikipedia)

Como não dá mais para postar figuras aqui (exceto as que já salvei como rascunho), coloquei diversos papeis de parede no meu outro blog, confiram…

wallpapers 1

wallpapers 2

wallpapers 3

wallpapers 4

wallpapers 5

wallpapers for children 1

wallpapers for children 2

wallpapers for children 3

wallpapers for children 4

Given the fact that I can no longer post images here (except for those that have already been saved as drafts), I have posted several wallpapers in my other blog, check them out in the links above!

Heavy metal is the law!


Isso veio daqui http://bigthink.com/strange-maps/560-a-world-map-of-heavy-metal-density

…que veio daqui http://copyranter.blogspot.de/2012/03/world-map-metal-bands-per-100000-people.html

…e também daqui http://mapofmetal.com/

“This map reflects the number of heavy metal bands per 100,000 inhabitants for each country in the world. It codes the result on a colour temperature scale, with blue indicating low occurrence, and red high occurrence [1]. The data for this map is taken from the extensive Encyclopaedia Metallum, an online archive of metal music that lists bands per country, and provides some background by listing their subgenre (Progressive Death Metal, Symphonic Gothic Metal, Groove Metal, etc).

Scandinavia is the world capital of heavy metal music. Leaders of the pack are Finland and Sweden, coloured with the hottest shade of red. With 2,825 metal bands listed in the Encyclopaedia Metallum, the figure for Finland works out to 54.3 bands per 100,000 Finns (for a total of 5.2 million inhabitants [2]). Second is Sweden, with a whopping 3,398 band entries. For 9.1 million Swedes, that amounts to 37.3 metal bands per 100,000 inhabitants.

The next-hottest shade of red is coloured in by Norway [3] and Iceland. The Icelandic situation is interesting: with only 71 bands listed, the country seems not particulary metal-oriented. But the total population of the North Atlantic island is a mere 313,000. Which produces a result of 22.6 metal bands per 100,000 inhabitants. That’s almost the double, relatively speaking, of Denmark, which has a score of 12.9 (708 metal bands for 5.5 million Danes)

The following shades of colour, from dark orange to light yellow, are almost all found in North America, Europe and Australasia. A notable addition to this list of usual suspects are Israel, and the three countries of Latin America’s Southern Cone: Chile, Argentina and Uruguay.

Some interesting variations in Europe: Portugal is much darker – i.e. much more metal-oriented – than its Iberian neighbour Spain [4], and Greece is a solid southern outpost of metal on an otherwise wishy-washy Balkan Peninsula.

On the other side of the scale, light blue indicates the worst – or at least loneliest – places to be a metal fan: Papua New Guinea, North Korea, Cambodia, Afghanistan, Yemen, and most of Africa outside its northern and southern fringe. According to the Encyclopaedia Metallum, there isn’t a single metal band in any of those countries [5].”

O sistema numérico Grego


(post salvo do finado site bit lascado, e complementado por fotos que achei)

A Grécia é um país localizado na península balcânica, no sudeste do continente europeu banhado pelo mar Mediterrâneo Oriental. Tem ao norte a Macedônia, ao sul o mar Mediterrâneo, a leste o mar Egeu, a oeste o mar Jônio.

O período da formação das cidades gregas vai do Séc. XX a.C. até o Sec. XII a.C .

Os povos formadores das cidades gregas foram:

• Aqueus (fundaram Mecenas),
• Dórios (fundaram Esparta),
• Jônios (fundaram Atenas) e
• Eólios

Ao estudar a história nos deparamos com uma enorme herança que este povo deixou para a humanidade e dela podemos citar:

• A arquitetura,
• A democracia,
• A literatura,
• A filosofia,
• O teatro,
• A escultura,
• O idioma

Quase todas as ciências tiveram origem grega e, obviamente, os gregos também foram responsáveis por um dos processos de criação de um sistema numérico.

O primeiro sistema numérico grego era denominado de Sistema Acrofônico e funcionava de um modo muito semelhante ao sistema numérico romano. Desde o século IV a.C., este foi substituído pelo Sistema Lônico Numeral, cada unidade, dezena e centena, tinha uma letra separada.

Sistema Acrofônico
Era um sistema de base decimal que utilizava os símbolos abaixo para a sua representação numérica.

O  primeiro sistema numérico utilizado pelos gregos foi o “Sistema acrofônico”, por volta do primeiro milênio a.C.. No sistema acrofônico , os números eram representados por símbolos; esses símbolos tinham como origem a primeiro letra do nome de seu próprio número.

No sistema acrofônico havia um grande problema. Para escrever um número muito alto, o número “9999”, por exemplo, teríamos que representá-lo com 36 símbolos, e isso seria muito complicado. Por esse motivo, algum tempo depois, foi introduzido um novo sistema numérico, que era baseado no próprio alfabeto grego.
 
O “Alfabeto grego” (Clássico) possui 24 letras, sendo que inicialmente possuía 27. “Stigma, Koppa e Sampi” haviam entrado em desuso; porém, para representar os valores 6, 90 e 900, foram inclusos no sistema alfabético numérico grego. 
 

                                                                                       Sistema Lônico

Neste sistema numérico cada letra grega representa um número, e ao escrever um número que tivesse mais de um dígito, dava-se a impressão de que se estava escrevendo uma palavra.

Neste contexto, era possível somar o valor de cada palavra e podemos dizer que foi desta idéia que surge o conceito místico sobre a numerologia.

Como as letras no alfabeto seriam também usadas para representar os números, os gregos precisavam de algum sinal para diferenciá-las, certo? E como eles faziam isso?
 
Para diferenciar os números das letras, era colocada uma espécie de “acento agudo” na parte superior direita da seqüência dos símbolos. 
 
Para representar números acima de 1000 (mil), além de colocar o “acento agudo” na parte superior direita, era também acrescentado um outro sinal na parte inferior esquerda da seqüência dos símbolos. Observe o exemplo na imagem abaixo.


 Nesse sistema, os gregos poderiam representar qualquer número sem grandes dificuldades.
 
Fontes – Referências:
 
ADKINS, adkins and ADKINS Roy – Handbook to Life in Ancient Greece, New York: Facts On File, 1997.
MURACHCO, H.G – Língua Grega, v.2 – Petrópolis: Editora Vozes, 2001.
Fontes – Sites:
http://www-history.mcs.st-and.ac.uk
http://www.ancientgreece.comhttp://www.ancient-greece.org

http://www.antigagrecia.com